Have you ever left your doctor’s office looking at your most recent lab work like its written in a foreign language?
Have you wondered what your lab tests are really saying about the functioning of your body?
Have you been curious to ask what is really “normal” and does it mean there is a “problem”?
As routine as blood work may be for both the healthy prevention-minded individual or the chronically health-challenged person, understanding what all those lab markers represent and truly indicate is anything but routine.
In this blog post, I will provide some foundational guidance on how to get the most out of commonly performed lab tests and help you to better answer the question, “What does this lab marker even represent?”
I will start by sharing some important definitions within the domain of blood chemistry testing. Then I will lay out my key tenets of lab testing that can be applied to nearly all types of laboratory tests. From here, I will begin a deeper exploration of each of the 10 tenets sharing insights such as the purpose and rationale for testing, and how exactly the “normal” lab ranges are created in the first place. I will then offer some perspective on how to modify one’s approach when performing and analyzing lab tests in order to extract the most (and correct) information from the tests being performed. Lastly, I will provide an extensive descriptive list of the most common lab tests I perform, what they represent, and how you can use such tests to make informed decisions about your health.
Disclaimer: While I am a physician, the information in this blog post is strictly informational in nature and is not and does not substitute for professional medical counsel from your healthcare provider. If you have general questions about the topics presented in the article, feel free to leave questions and comments below as well as share this information with your medical providers as part of your care.
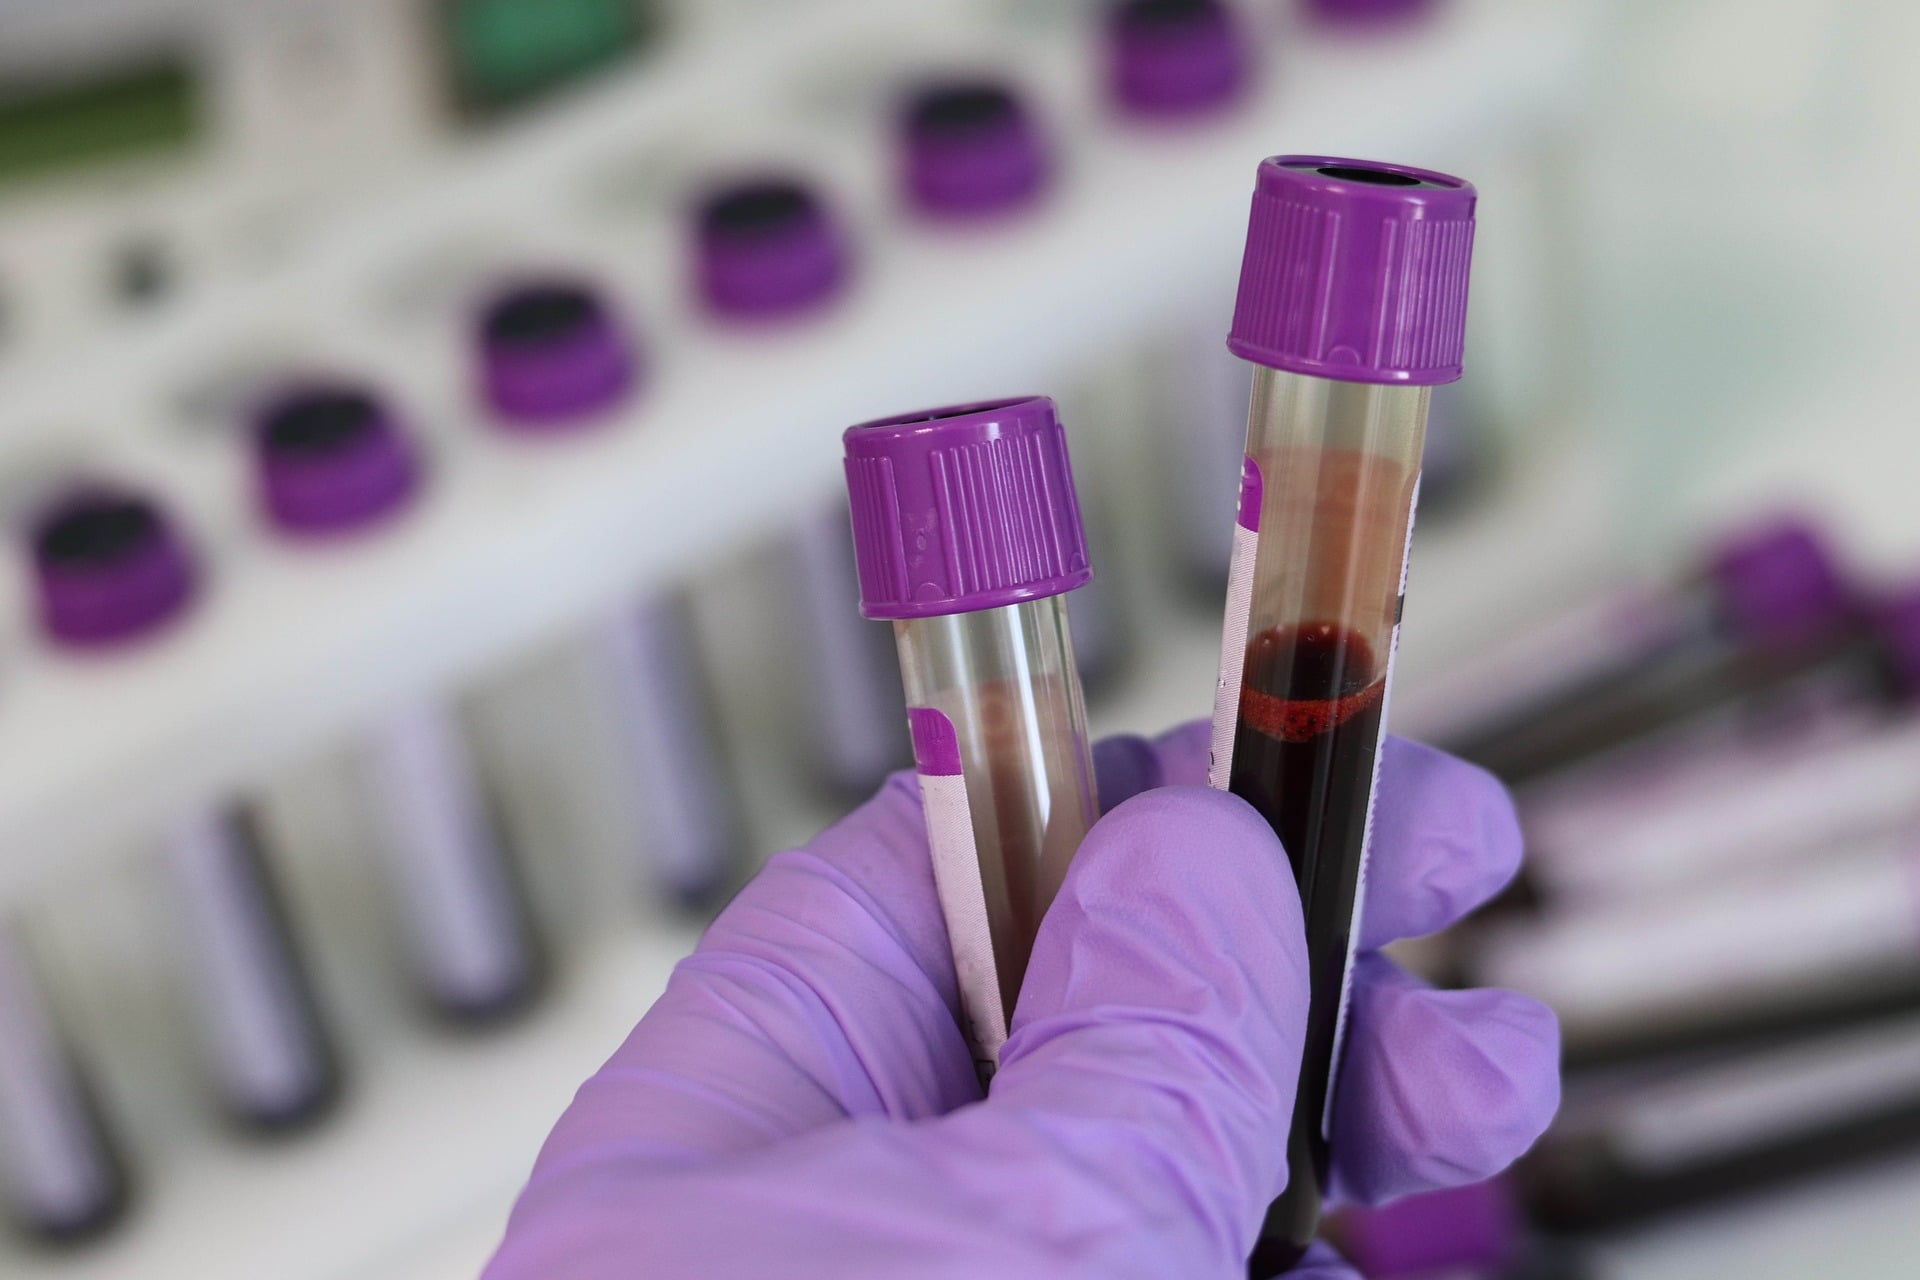
With that, let’s dig into learning more about blood chemistry!
Blood Chemistry: Basic Definitions
Blood chemistry can be considered any laboratory test performed on a component of one’s blood. While we colloquially use the term “blood” to represent the reddish colored substance flowing through our arteries and veins, what exactly is “blood” and why should I care?
Blood is primarily made up of four components: plasma, red blood cells, white blood cells and platelets. Plasma is approximately 55% by volume of our blood and can be thought of as an aqueous solution (mostly water) comprised of various ions (like sodium), proteins (like albumin), dissolved gases (like oxygen or O2) and nutrients (like vitamin D).
Have you ever had your vitamin D level checked? It is typically measured from the plasma. Plasma is essentially the liquid vehicle for the red blood cells, white blood cells and platelets to circulate around the body. In order to separate these cells from the plasma, labs commonly use a centrifuge whereby gravity (and the centripetal force) act on the denser red blood cells and white blood cells so that they collect at the bottom of the test tube.
Additionally, you may have seen the term “serum” used before in laboratory testing. Serum can be thought most simply as plasma without clotting factors like fibrinogen. Most labs will preferentially run tests using plasma as compared to serum despite their essential interchangeability as processing time is decreased when using plasma (you don’t have to wait for the “blood” to clot!). As this post cannot get into the more subtle differences of using serum vs. plasma, I simply want you to recognize these terms on your lab tests and understand what they represent.
With the aqueous plasma separated from the cells of the blood, one is left with red blood cells, white blood cells and platelets. While we will talk more about each of these cells a little bit later in the lab test descriptions, it is important to note that red blood cells themselves are also commonly analyzed for their various components. Some common tests run using the red blood cells themselves include RBC magnesium (the amount of magnesium in the red blood cell as compared to the serum/plasma) as well as the volume of various essential fats such as the omega-3 fats, DHA and EPA.
A final note about definitions and lab test preparation. Some labs will also run tests on “whole blood”, which is essentially the “blood” without removing any of the plasma or cells. Common whole blood tests include heavy metal tests for whole blood mercury and whole blood lead.
Has this primer on blood piqued your interest? Learn more about blood components and blood chemistry from Khan Academy.
Blood Chemistry: Basic Tenets
In this section, I want to provide you with some of my essential tenets or rules when performing laboratory tests as a physician.
- Lab testing results INSIDE the normal range DO NOT ensure there AREN’T problems related to the lab marker measured (sorry for the double negative).
- Lab testing results OUTSIDE the normal range DO NOT ensure there IS a clinically significant problem related to the lab marker being measured.
- Lab tests are best used as information to paint a broad picture of a human being and must be used alongside the clinical presentation and symptoms of the individual in order to paint that picture.
- One should be careful to select tests that either 1. provide essential markers of physiological functioning, (ex. Complete Blood Cell Count) or 2. provide information that would inform/change clinical management.
- If a result from a blood test does not fit the clinical picture, repeat it and reassess.
- Nearly all tests must be analyzed as trends for the individual, being repeated over time in the context of the changing clinical picture and symptoms of that individual.
- When performing lab tests over time to assess trends, try to collect the blood samples in the same setting (ex. fasting, but hydrated in the late morning). Consistency of setting and timing is more important in nearly all cases than the precise timing of one lab itself.
- If one is testing whether a certain hormone is LOW (ex. testosterone), generally speaking one should test for that hormone when is it normally the HIGHEST based on hormonal rhythms.
- If one is testing whether a certain hormone is HIGH (ex. insulin), generally speaking one should test for that hormone when is is normally the LOWEST based on hormonal rhythms, dietary consumption, exercise, etc.
- Many lab markers are quite variable and can be affected by psychological or emotional stressors (like cortisol and glucose). Follow this tenet, along with Tenet 5 when in doubt about the results of certain lab markers before making major therapeutic decisions such as starting/stopping a medication or pursuing further testing/imaging, etc.
I could provide more essential tenets, but this is more than enough to get us started into a more thorough discussion of these points with clinical examples to make it all the more practical and tangible.
Tenets 1 & 2: What exactly is “normal” and “abnormal”?
Starting with Tenets 1 and 2, I want to first define lab ranges as well as normal vs. abnormal in order to help clarify the nature of these essential rules. You may be familiar with lab work containing “normal” ranges whereby any lab result existing outside of the respective high and low “normal” values is considered abnormal. In order to construct such “normal” ranges, labs will typically perform a test on a set number of individuals (say 5,000 people) and create a statistical normal distribution from those results. From there, they will demarcate a 95% confidence interval or range such that a total of 95% of the people who took that particular test will have their results be inside the “normal” range. More specifically, individuals with results above the 97.5th percentile and below the 2.5th percentile will be considered abnormal and everyone else, even if they are just inside the total 95% range will be considered normal.
Now it doesn’t take much analytical finagling to see some of the main issues and limitations of using this statistical approach. When one looks at the lab results of the test population (our group of 5,000 for example) you will see a large continuous distribution. Rather than try to provide an analytical approach that considers the nature of this continuum, labs choose to take a binary approach whereby certain points on this continuum “are broken” so that lab work results outside of the demarcated range (>97.5th percentile and <2.5th percentile, for example) are considered abnormal and everything else inside the “normal” range is considered normal. But is the person at the 97th percentile and just inside the upper limit of “normal” actually “normal” or are they a certain percentage away from the average for the group with a certain probability of having an issue related to that lab result?
Another metaphor I commonly share with folks in my critique of using the 95% confidence interval as the “normal” lab range involves walking between two cliff edges. With the 95% confidence interval method, someone at the 97th percentile will be standing, metaphorically, mere inches away from one cliff edge and considered normal, while someone at the average or 50th percentile would be walking, metaphorically, exactly in between the two cliff edges and would also be considered normal. I don’t know about you, but walking in the middle between two cliff edges versus mere inches away from the cliff edge doesn’t appear to be the same thing and should necessitate different diagnostic and therapeutic approaches.
Tenet 2: Clinical example
Before I get into a discussion of how we could modify analytical methods for these lab work tests to avoid the “normal” scenario I have just described above, I want to specifically address the message behind Tenets 1 and 2. Regardless of the lab range used, having an “abnormal” result does not guarantee there is actually a clinically significant problem that needs to be addressed.
As an example, in December 2019 I performed some basic blood chemistry on myself that included a uric acid test. My uric acid was 3.6, which was just below the normal low cutoff for males. Now most people are likely familiar with uric acid as high levels can lead to crystallization and deposition in joint tissue manifesting as the painful condition known as gout, but in my case, I actually had LOW levels, but did this represent an issue I should explore further? The longer answer is yes, I should track and monitor this, but the short answer was no. Uric acid levels can be affected by many things, including the intake of dietary nucleotides known as purines commonly found at higher levels in liver, mackerel, and alcohol. At that particular time of the test, I was consuming relatively lower amounts of food overall, a low amount of dietary purines and had fasted for nearly 24 hours prior to the test. In this case, it is very likely that the” low” uric acid was a reflection of my fasting and dietary state rather than a problem I needed to investigate further.
Tenet 1: Clinical example
Now that I have provided an example of when an abnormal lab test result may not actually represent anything clinically significant, let me share an example of Tenet 1, where even with “normal” lab work, there can still be significant health issues. Sadly, many of you have likely experienced this exact scenario, where you had numerous symptoms, but were told your lab tests were “normal” (remember, you could have been in the 95th percentile and still have been “normal”).
There is an ongoing debate about the ideal “normal” range for Thyroid Stimulating Hormone or TSH. TSH is produced by the pituitary gland as a signal to the thyroid to produce thyroid hormone. As the TSH rises, one should also see a rise in thyroid hormones T4 and T3. If there is an issue with the thyroid gland itself, such as with Hashimoto’s thyroiditis, an autoimmune disease affecting the thyroid gland, the thyroid may not actually be able to respond to the pituatary’s TSH signal. A typical metaphor involves picturing TSH as someone knocking on your front door, but the thyroid gland (you) are sitting upstairs listening to loud music and do not hear the person and don’t respond. After a certain period of time without a response, that person knocking on your door will likely try to bang a little louder, just as the pituitary will start to increase the TSH to try and achieve its goal of producing T4. The longer you don’t respond, the louder the knocks will get and the higher the TSH will rise.
Unfortunately this process is quite variable and the human body is quite resilient in adapting to a compromise in thyroid function, such that an individual who is actively experiencing damage to the thyroid gland may not actually see an increase in TSH above the typical standard upper limit for TSH of 4.5 microIU/mL for YEARS, yet be underproducing T4 and T3 to the detriment of essentially all organ systems. While there are many other reasons why the upper limit of the TSH range should be much lower, around 2.5 microIU/mL, that I don’t have time to get into in this post, my main point of sharing this description was to provide an unfortunately common example of how “normal” lab tests may actually be hiding greater issues that need to be addressed. The TSH scenario also showcases a great example of Tenet 3, which I will elaborate upon now.
Tenet 3 and 4: How to properly choose and interpret lab tests in the context of symptoms
Lab work findings MUST be used alongside the person’s clinical picture to paint a broad picture of the person’s physiological and overall health. The best clinicians are able to analyze numerous lab findings, identifying patterns and looking for outliers, all in the effort of synthesizing a picture of the person before them. We don’t suggest treatments to lab results, we suggest them to patients, and it is critical to understand how certain lab tests are correlated to certain symptoms and underlying patterns of dysfunction and to interpret things appropriately. It is also critical to understand the clinical question you are seeking to answer when performing a particular test. In the world of clinical medicine we commonly talk about a particular test’s positive predictive value or how likely, given a positive or abnormal result, does the lab finding represent an actual problem? You can probably surmise that labs tests are not perfect and if you take 100 healthy people and have them perform a test looking for thyroid antibodies, for example, that some small fraction of those healthy people will actually come back with positive or abnormal results, but is it actually abnormal? Indiscriminately running certain tests in individuals who have no symptoms or signs of clinical dysfunction that could be detected with a given lab marker can be fraught with much risk as one can easily find “problems” where there really are none, and create much more fear and trepidation than otherwise was warranted.
One of the potential downsides of functional medicine is the over-utilization of testing with unvalidated references ranges. While we could certainly argue in the example I provided above regarding thyroid antibody testing, that one could actually identify someone with positive antibodies years before they manifest signs of overt hypothyroidism, but at what cost? I have seen far too many individuals given inappropriate diagnosis such as hypothyroidism based on “functional” ranges of Free T3 and even provided thyroid replacement medication which they didn’t need! Bringing this exploration to a close, I simply want to share the risks and benefits of performing testing and that gathering data without understanding the question you are asking with a given test can sometimes lead to more problems than a person ever had clinically.
Tenet 5: What do I do if lab work comes back abnormal and I don’t understand why?
Tenet 5 states if a lab value does not make sense clinically, repeat it and reassess. As an example, I will commonly see potassium levels outside the normal range in people previously with no electrolyte issues. What gives? Potassium resides mainly inside of cells including red blood cells, and it is common for certain lab samples as part of their processing to become hemolyzed such that the red blood cells rupture and release their contents into the plasma. In this scenario, one can suddenly see a much larger volume of potassium in the plasma and the appearance of dangerously high potassium levels. While labs should report the appearance/process of hemolyzation in the lab results, compromising the accuracy of certain tests like potassium, this is not always the case and it’s important to inquire about a particular test that has never been an issue when it suddenly appears abnormal and to repeat that before making any hasty conclusions.
This discussion of viewing lab tests and matching them with the clinical context as well as repeating labs that seem quite abnormal and not coherent with the clinical picture leads us nicely into a deeper exploration of Tenets 6 and 7. While it may seem obvious that if a lab test comes back and seems clearly abnormal and incoherent with your symptoms and clinical picture, one should repeat it and reassess, but what do you do when certain lab tests come back abnormal and appear to correlate with your symptoms and concerns?
Tenets 6 and 7: How to properly interpret lab work using trends
Generally speaking, we must utilize trends, repeating tests in similar contexts over time to better understand whether certain lab tests are outliers or are true reflections of certain physiologic states in the body (1).
As an example, I had one patient complete a cholesterol or lipid profile with two separate labs on the same day in the fasted state, and even with seemingly identical collection conditions, her total cholesterol and LDL-C markers varied by over 20 units mg/dL! In the case of total cholesterol and LDL-C, many individuals are often recommended or strongly pushed to start taking a statin medication like Atorvastatin after only 1 lab test involving the markers in question! For readily available, relatively inexpensive and variable tests like total cholesterol and LDL-C, we should generally repeat a test 2 or even 3 times looking for trends and creating averages to match with the person’s clinical picture before considering a higher risk therapy such as medication. As Tenet 7 illustrates, while repeating tests like the lipid profile over time is critical for gathering information about certain physiological markers, one should also strive to repeat tests in a similar context considering dietary intake, hydration, timing and exercise as key variables that could affect a given lab marker.
While consistent timing is adequate for most labs, there are a few notable exceptions that I would like to highlight as part of my elaboration of Tenets 8 and 9.
Tenet 8: How to test for hormonal deficiencies
When one is choosing to test for certain hormones, it is important to understand the basic physiology and rhythm behind the hormones so one can appropriately coordinate the timing and setting for a given lab test. When one is concerned about a lab marker being too low, generally speaking, we will pick to test for that lab marker when it should be its highest. Simply testing when it’s at an average level for the day and finding out it’s slightly lower than expected is not particularly helpful in clinical diagnosis. Testing for the lab marker when it should be high and seeing that it is low or at the lower end of the normal range greatly increases the likelihood that what we have identified is actually a potential problem worth addressing. Examples of hormone tests that fall under this categorization are serum cortisol, testosterone (in males) and progesterone (in women).
For example, if someone is experiencing profound fatigue, salt cravings and has noticed changes to their skin coloration or texture, they may want to consider testing for primary adrenal insufficiency or Addison’s disease, a rare autoimmune condition affecting the production of adrenal hormones such as cortisol. As part of this assessment, an individual will typically perform a serum cortisol test first thing in the morning when cortisol typically peaks. If the level is low or lower than expected, this would provide helpful information about a potential primary adrenal issue. The diagnosis of Addison’s is much more complex than simply measuring a single morning cortisol, but I have provided this example as a helpful illustration of the hormonal deficiency testing scenario.
Additional examples of hormonal tests that require specific timing for sample collection include testosterone in men and progesterone in women. Testosterone typically peaks in the morning and is thus best assessed, when one is worried about low levels, in the morning hours. Progesterone typically peaks for menstruating women in the second portion of the menstrual cycle known as the luteal phase. With the increase in Luteinizing Hormone (LH) at ovulation, women should see a steady rise in progesterone through a significant portion of the luteal phase. If someone is suspecting a progesterone deficiency, which can be seen in some women with early miscarriages or recurrent pregnancy loss, one should seek to test progesterone levels during the early portion of the luteal phase. Urinary hormone metabolite tests such as Precision Analytical’s Comprehensive Dried Urine profiles utilize this same principle except with the use of urine samples instead of blood.
Now you may be asking, does this principle apply to thyroid hormone? The answer is a little bit more complex, but yes!
Thyroid Hormone Circadian Rhythms
We have known for some time that Thyroid Stimulating Hormone (TSH), which is secreted from the pituitary as a signal to the thyroid to increase thyroid hormone production, follows a natural circadian rhythm whereby it is lowest through the morning and early afternoon, often reaching its nadir around 14:00 and rising again through the evening until reaching its peak in the early morning hours around 02:00. While one would think that given this rhythm there would be a direct rhythmic correlation between the growth/production signal of TSH and the primary hormone produced in the thyroid, T4, but this doesn’t actually appear to be the case. A study by Russel et. al, in 2008 actually showed a rhythmic correlation between TSH and Free T3, which is made primarily outside of the thyroid gland itself by the chemical modification of T4 by a specific class of enzymes known as deiodinases (2). In their study, they found that Free T3 levels appeared to follow a rhythmic pattern about 90 minutes behind the TSH signal such that the Free T3 levels were peaking in the early morning hours, reaching their average around 10:00 and reaching their nadir in the late afternoon around 16:00 (2).
As far as testing is concerned, in the case of primary hypothyroidism where the thyroid gland is unable to produce adequate levels of thyroid hormone, one is typically diagnosed when there is an elevation in TSH (the growth signal) and a low level of Free T4 or T3. Using the principles of Tenet 8, in seeking to determine if a hormone level is low (ex. Free T3), it would appear based off the normal rhythms of Free T3 to test as early in the morning as possible as levels typically peak in the early morning hours (understanding no labs are actually open at 03:00).
Tenet 9: How to test for hormonal excess
Making our way into the home stretch of our lab testing tenets, I want to share some thoughts around testing for hormonal excess. Using the same principles of Tenet 8, when testing for hormonal EXCESS, one should generally test for a given marker when it should be LOW. A primary example for this tenet involves the hormone insulin. Insulin provides numerous signals to the cells of the body involving growth and metabolism, but one of its primary roles is to assist with getting glucose from the blood plasma into the cells themselves so they can carry out further chemical modifications to the glucose molecule in an effort to make the “energy currency” (ATP) that the cell can actually use.
When you consume food, especially food containing carbohydrates and protein, insulin levels will rise accordingly to help assist in the cellular utilization of glucose and other nutrients, but then will come back down to a low steady state until the next meal. As you can guess, when someone has fasted and gone without food for over 8 hours, circulating insulin levels should be quite low at this relative steady state level. If glucose levels rise, however, to greater amounts than the cells can handle, they may “stop listening” to the insulin signal and glucose will stay in the blood plasma and not get into the cells. Over time, the pancreas, which produces the insulin hormone, will start to increase the production of insulin in an effort to get the glucose out of the blood and into the cells. What you will see is that the new steady state for insulin and the amount of insulin needed to carry out the same functions of nutrient signaling and partitioning increases. This phenomenon is defined as insulin resistance and is typically the first stage of metabolic dysfunction leading to frank diabetes and a host of other cardiometabolic issues.
In seeking to identify whether an individual has issues with insulin resistance or higher than expected levels of insulin, it is best to test for these levels in the FASTED state when levels should be low. A fasting insulin, drawn after 8-12 hours without food that is abnormally elevated (Functional range > 7 micro IU/mL) would be an early indication of developing insulin resistance. For those curious, the standard ranges for fasting insulin from most labs goes all the way up to 24.9 micro IU/mL, which is like waiting for a ship to be 99% sunk before telling people to get into the lifeboats.
Tenet 10: How Stress Can Affect Your Labs
We’ve reached our last tenet! While it may seem obvious to most that psychological stress can negatively impact one’s health in many ways, it is less commonly known and accepted that such stressors can have impacts on certain lab markers. While most doctors are well aware of the phenomenon known as “white coat hypertension” whereby someone’s blood pressure when taken in the doctor’s office is significantly higher than when it is taken outside of the office, they are much less likely to acknowledge that certain blood markers can be affected by a similar stress induced phenomenon.
While most lab markers reflect electrolytes or enzymes whose levels are intimately controlled by autonomic processes, there are some markers such as cortisol and glucose as well as insulin and even the white blood cell count that can be impacted by stress and severe trauma. Acknowledging the importance of using trends and clinical context, one should ensure to look at the bigger picture and avoid making dramatic decisions from one lab test especially if the results did not make sense with the clinical picture. Do not be afraid to ask your healthcare provider whether a certain lab, if abnormal, could have been affected by stress or some other environmental factor and would be worth repeating.
What is the best method of lab analysis?
As I hope is fairly clear by now, using current standard laboratory ranges and restricted testing to often minimalistic and disease centered standards is not best practice. Many of the integrative and functional medicine communities have sought to improve upon current laboratory ranges and utilize more clinically oriented tests to improve patient outcomes. Moving away from standard lab ranges and running more tests, however, can also create issues and it is important to balance these considerations when utilizing more expansive testing and/or functional ranges.
When it comes to creating more optimal reference ranges for individual labs, I will typically employ 2 primary techniques. The first technique is a simple statistical modification whereby I utilize current lab ranges and apply a statistical narrowing, creating an optimal range that is closer to a 70% normal range rather than a 95% normal range. In doing this, one must acknowledge that one will get more “abnormal” test results, but that one can also detect areas of concern sooner, perhaps while they are developing, and intervene before there is fully compromised organ function, for example. There are obvious limitations to this technique as we are still not necessarily utilizing samples from robust healthy individuals to create our 75% normal reference interval, but it is indeed an improvement upon the much too board 95% normal reference interval.
The second technique to employ involves frank alteration of the lab range entirely either through testing of healthy individuals to create a new range or utilizing existing epidemiologic research that points to increases in mortality (dying sooner, dying at a given age at a higher rate than expected) or other disease outcomes when individual markers are above or below a certain threshold. A great example of utilizing epidemiologic data to develop a more robust, optimal reference range can be seen with data from postmenopausal women in the Women’s Health Iniative. The study authors found that even after controlling for potential confounding variables and lab markers, individuals with a WBC count above 6.5 x10^3 cells/microliter started to see an increase in all cause and cardiovascular disease mortality (3). Additionally, there were some indications that individuals with WBC counts below 4.1 x10^3 cells/microliter could also be at risk for increased mortality with trends becoming more pronounced for individuals in the 3rd and 2nd deciles (3). While it is still challenging to generalize these findings to a men and others across a larger population, this type of study data can be used to construct narrower and more representative optimal lab ranges.
To wrap up, below you will find a table of the most common and readily available lab tests that I commonly run as a physician that either a) provide critical information regarding physiologic functioning or nutrient status, or b) provide information that would change clinical management. I have organized the markers into different subsections and provided short descriptions of their potential clinical utility. I have also provided pricing for such tests if ordered through Professional Co-op Services (the lab service I use in my clinic) as many of these tests, while basic and critical, are not routinely covered by most insurance companies until you have been diagnosed with a disease such as diabetes, kidney disease, etc.
For those interested in getting their own blood chemistry testing, I am currently offering individuals outside of NY, NJ, RI and MA to receive a standardized blood chemistry panel, a personalized blood chemistry report and a 30 minute virtual visit with me to discuss the findings as they relate to one’s medical history and personal health concerns.
You can learn more about the opportunity for personalized blood chemistry testing including a visit with me from the link below.
Get a Personalized Blood Chemistry ReportDisclaimer: As another reminder, while I am a physician, the information about individual lab tests is strictly informational in nature and is not and does not substitute for professional medical counsel from your healthcare provider. Please use this educational material as part of a larger discussion with your current healthcare provider.
Common Lab Markers
| Lab Marker | Organ(s) | Description | Price |
|---|---|---|---|
| Thyroid Stimulating Hormone (TSH) | Pituitary Gland | Hormone produced by the pituitary as a signal to the thyroid to produce thyroid hormones T4 and T3. Elevations in TSH, when correlated with T3 and T4 levels typically indicate primary hypothyroidism. | $12 |
| Free T4 | Thyroid | Primary hormone produced by the thyroid gland in its free, bioavailable form. | Combined with TSH, $32 |
| Free T3 | Thyroid | Primary bioactive thyroid hormone produced primarily outside of the thyroid gland from its precursor T4. | Combined with TSH, $52 |
| Total Testosterone | Gonads | Sex hormone present in much higher amounts in men than women. When testing for deficiency in men, one should perform this test in the morning. | $25 |
| Sex Hormone Binding Globulin | Liver and Gonads | A transport protein produced in the liver that binds/carries hormones such as testosterone and estrogen. Can be used alongside Total Testosterone to calculate a free, bioavailable amount of testosterone. | $39 |
| Estradiol | Gonads | Sex hormone present in much higher amounts in women than men. It is considered the primary bioactive estrogen in women alongside estrone and estriol. | $25 |
| Progesterone | Gonads | Sex hormone present in much higher amounts in women than men. When testing for deficiency, it is best to test (in menstruating women) in the early portion of the luteal phase (Days 18-22). | $25 |
| Lab Marker | Nutrient | Description | Price |
|---|---|---|---|
| Transferrin | Iron | A transport molecule used to carry iron in a controlled manner in the blood. | $15 |
| Total Iron Binding Capacity (TIBC) | Iron | An indirect measure indicating how much iron you are capable of binding/transporting with transferrin. Higher levels typically indicate lower total iron status. | $19 as part of full iron profile |
| Unsaturated Iron Binding Capacity (UIBC) | Iron | An indirect measure indicating how much transferrin is still available to bind iron. Typically calculated as the difference between TIBC and Serum Iron. Higher levels typically indicate lower total iron status. | $19 as part of full iron profile |
| Serum, Iron | Iron | The amount of iron in circulation that is bound between transferrin and ferritin. | $19 as part of full iron profile |
| Iron/Transferrin Saturation | Iron | The percentage of transferrin bound with iron. This should be around 1/3rd or 33% of the total binding capacity. | $19 as part of full iron profile |
| Ferritin | Iron | A transport and storage protein for iron molecules. It can be elevated in the setting of acute or chronic inflammation even when bioavailable iron levels are inadequate. I do not recommend running this test in isolation without the other iron markers. | $19 as part of full iron profile |
| 25-OH Vitamin D | Vitamin D | 25-OH Vitamin D is the precursor molecule for the bioactive form of Vitamin D known as 1, 25-OH Vitamin D. As 25-OH levels are more stable in the blood when compared to 1, 25-OH, I recommended for most individuals to only measure 25-OH levels in monitoring Vitamin D status. The “Vitamin D” in fortified food and most supplements is actually a precursor to 25-OH in the body. | $29 |
| Serum, Vitamin B12 | Cobalamin (B12) | Vitamin B12 is a critical B vitamin also known as cobalamin that is readily found in animal foods. This test only shows the amount of B12 in serum and does not guarantee sufficiency in tissues or certain cells. Individuals with values less <400 pg/mL and/or clinical symptoms of B12 deficiency may want to perform further testing including serum methylmalonic acid and homocysteine | $12 |
| Serum, Methylmalonic Acid | Cobalamin (B12) | Methylmalonic acid (MMA) is a more sensitive and functional marker for B12 deficiency. Levels of MMA become elevated when there is an insufficient level of bioavailable B12 to help convert MMA into another organic acid. | $69 |
| Serum, Folate | Folate (B9) | Folate in a critical nutrient involved in the production of nucleotides, a key component of DNA, and thus, when deficient, can lead to decreased production of key cell types including the most numerous cell in the human body, the red blood cell. Like serum B12, normal serum folate levels do not guarantee sufficiency in all tissues and one may wish to consider more advanced testing such as RBC folate or urinary formiminoglutamic acid (FIGLU) to assess for functional deficiency. | $12 |
| Serum, Magnesium | Magnesium | Magnesium is a critically essential nutrient that is often deficient from people’s diets. As such, many forms of magnesium salts including magnesium chelate and magnesium citrate are popular supplements. Serum magnesium simply measures the amount of circulating magnesium and again, adequate serum levels do not guarantee adequate levels in all tissues/cells. Some individuals have chosen to use RBC magnesium as a better marker of cellular magnesium status. | $5 |
| Homocysteine | B12, Folate, B6 | Homocysteine is a unique molecule involved as an intermediate in the methionine and transsulfuration pathways. High levels have been directly implicated to cause arterial damage and are associated with cardiovascular disease. In the setting of both B12 and folate deficiency, one can see marked elevations in homocysteine and it is often a more sensitive marker of folate and B12 status than serum levels of those markers alone. | $25 |
| Lab Marker | Components | Description | Price |
|---|---|---|---|
| Lipid Profile | Total Cholesterol, LDL-C, HDL-C, Triglycerides, VLDL-C | A standard lipid profile contains multiple markers of lipoprotein and cholesterol metabolism. HDL, LDL and VLDL are different forms of lipoproteins (high density vs low density and very low density). Lipoproteins are specialized proteins that transport fats including cholesterol around the blood as fat and water don’t quite mix. The markers LDL-C and HDL-C indicate the amount of cholesterol inside of the LDL particle and HDL particle respectively. Triglycerides are a unique blood fat composed of 3 long fatty acid “tails” attached to sugar molecule known as glycerol. For those desiring information about the number and size of LDL and HDL particles themselves, one should consider an NMR Lipoprofile test instead of the basic lipid profile. | $15 |
| NMR Lipoprofile | Abbreviated List: Lipid Profile + 1. LDL-Particle Count 2. LDL Size 3. Small LDL-Particles 4. HDL-Particle Count 5. HDL Size | This comprehensive lipid analysis provides more information about the number and size of lipoproteins and can indicate underlying issues with blood sugar control/metabolism. Individuals with high levels of LDL-particles, independent of LDL-C, are at increased risk for cardiovascular disease. I typically do not recommend using this test for screening and perform it in individuals at increased risk for cardiovascular disease, with a strong family history or for those who have concerning findings on their basic lipid profiles. | $65 |
| Lipoprotein (a) | A specialized lipoprotein with a similar structure to an LDL particle that has been associated independently with the development of cardiovascular disease (CVD). Levels in most ethnicities are heavily determined by genetics and there are no current drug or supplement therapies showing dramatic and consistent lowering effects for those with elevated lp(a) levels. Lifestyle based interventions also do not appear to significantly impact lp(a) levels. Despite the limited therapeutic options for lowering lp(a) levels, many leaders in cardiology have pushed for increased lp(a) screening in order to identify individuals with higher CVD risk, especially those with otherwise normal lipid and NMR profiles. | $19 | |
| Hemoglobin a1c | Hemoglobin a1c is a specialized test also known as a glycated hemoglobin test. Glycated hemoglobin is essentially the amount of glucose “stuck” to hemoglobin in red blood cells. It has been used as a fairly accurate marker to determine someone’s average blood glucose level over a 2-3 month period. This marker, however, is not accurate for Individuals with rapid turnover of red blood cells related to anemia or other consumptive conditions and I typically defer to using individual glucose measurements alongside fasting insulin in those cases. | $16 | |
| Fasting Insulin | Fasting insulin is typically run alongside hemoglobin a1c and fasting glucose to get a broad picture of someone’s blood glucose levels and how much insulin is needed to maintain those levels. Elevations in fasting insulin above 7 micro IU/mL generally indicate early insulin resistance. | $19 | |
| 1-5 Anhydroglucitol (Glycomark™) | This specialized marker is used to determine the nature of any blood sugar excursions above ~180 mg/dL. Low levels of this marker indicate significant blood glucose spikes and can be used alongside fasting insulin and hemoglobin a1c to assess blood glucose control. | $39 |
| Lab Marker | Components | Description | Price |
|---|---|---|---|
| Complete Blood Cell Count (CBC) | 1. Hemoglobin 2. Hematocrit 3. MCV 4. MCH 5. MCHC 6. RDW 7. WBC Count 8. RBC Count | This test has multiple components assessing the size and number of red blood cells (RBC’s) as well as the hemoglobin concentration within the red blood cells. Hemoglobin is a specialized molecule designed to carry oxygen and deliver it to the cells and tissues of the body and when low is considered clinical anemia. The CBC also assesses for Red Cell Distribution Width (RDW), which is the variation in size of one’s RBC’s such that individuals with lots of variation will have a higher RDW. The test also provides a total number of white blood cells (WBC’s). Most of these markers are volume dependent and one can see significant variation when an individual is dehydrated vs. well hydrated. | $8 when run with platelets |
| Platelets | Platelets are a unique cell that function primarily as part of the clotting cascade when there are internal or external injuries (ex. cutting your finger) Platelets can be elevated in a state of acute or chronic inflammation and deficiencies of platelets can predispose an individual to bleeding. The commonly used drug aspirin blocks platelet function. | $8 as part of a CBC | |
| Comprehensive Metabolic Panel | 1. Glucose 2. BUN 3. Creatinine 4. Sodium 5. Potassium 6. Chloride 7. Carbon Dioxide 8. Calcium 9. Total Protein 10. Albumin 11. Globulin 12. Total Bilirubin 13. Alkaline Phosphatase 14. AST 15. ALT Bonus: 1. Uric Acid 2. LDH 3. GGT 4. Phosphorus | The comprehensive metabolic profile has numerous components including essential electrolytes as well as prominent proteins including albumin and globulin. Additional markers include bilirubin, which is a metabolite of the breakdown process of hemoglobin from RBC’s and is found in bile produced from the liver. The enzymes AST and ALT, which are found in high proportions in liver cells, are also included and when elevated can indicate damage to the liver. Creatinine, a byproduct of creatine metabolism in muscle tissue is also measured and is used to determine the GFR that assesses someone’s kidney function. While high creatinine can indicate kidney dysfunction, low creatinine levels can also indicate low or decreasing muscle mass. Total protein is made up of both albumin (a carrier protein) and globulin (immune proteins) and low levels can indicate liver dysfunction or catabolic physiology. Some metabolic profiles also include the additional markers 1. Uric acid, 2. LDH, 3. GGT and 4. Phosphorus, which are critical markes for understanding cell turnover, red blood cell function, liver health and nutritional status respectively. | $15 or $20 when including the 4AC markers |
| Lab Marker | Components | Description | Price |
|---|---|---|---|
| High sensitivity C-Reactive Protein (hs-CRP) | N/A | hs-CRP is a sensitive assay testing for the acute inflammatory protein C-reactive protein. C-reactive protein is synthesized and released from the liver after stimulation from certain immune cells as part of a coordinated inflammatory response. At baseline in someone who is not acutely sick, optimal levels should be below 0.5 mg/dL. Elevated levels, however, do not point to a specific source or cause for the inflammatory response, only that an inflammatory response is occuring. As such, it is critical to correlate with clinical contexts and individual trends. | $19 |
| White Blood Cell (WBC) or Differential Cell Count | Total WBC’s 1. Neutrophil % 2. Lymphocyte % 3. Monocyte % 4. Eosinophil % 5. Basophils % | White Blood Cells (WBC’s) are one of three primary cells in the blood including red blood cells and platelets. The term WBC’s describes a broad class of immune cells that primarily include 5 major subtypes: Neutrophils, Lymphocytes, Monocytes, Eosinophils and Basophils. Neutrophils should be the most prominent WBC and serve as the primary non-specific responder in the acute inflammatory response. Levels can be elevated during an acute illness such as a bacterial infection. Levels can be low in certain immunodeficiency states and predispose an individual to certain infections. Lymphocytes are a broad class of immune cells that are part of the adaptive immune system including both B and T Lymphocytes. They are the second most prominent immune cell in the blood after neutrophils. Levels can be elevated as in the case of certain viral infections and autoimmune conditions, and levels can be low, usually in relation to elevations in the neutrophil percentage. Monocytes are typically the third most prominent WBC in the blood. Once monocytes migrate from the blood into tissues they become macrophages and serve multiple functions within the immune system. Elevations in monocytes can be seen in conditions of chronic inflammation such as chronic viral infections, autoimmune disease and cancer. Eosinophils are typically the 4th most prominent WBC and generally circulate at lower levels than the other WBC’s. Eosinophils can become more prominent and activated in the setting of parasitic infections or in the setting of allergic stimulation and activation of mast cells. Elevated eosinophils can also be seen in aberrant immune responses related to certain drugs such as the immunomodulating drug class of TNF-inhibitors. Basophils are the least common immune cell and circulate in very low levels in the blood. Elevated basophils are sometimes seen alongside elevated eosinophils, but can be independently elevated in the setting of chronic inflammation or immune dysregulation as part of cancer, autoimmune disease or chronic infections like tuberculosis. | $10 as part of a CBC with Differential |
References
1) David A. Lacher, Jeffery P. Hughes, Margaret D. Carroll. Estimate of Biological Variation of Laboratory Analytes Based on the Third National Health and Nutrition Examination Survey. Clinical Chemistry. Feb 2005, 51(2) 450-452.
2) W. Russell, R. F. Harrison, N. Smith, K. Darzy, S. Shalet, A. P. Weetman, R. J. Ross. Free Triiodothyronine Has a Distinct Circadian Rhythm That Is Delayed but Parallels Thyrotropin Levels, The Journal of Clinical Endocrinology & Metabolism. Volume 93, Issue 6, 1 June 2008, Pages 2300–2306.
3) Kabat GC, Kim MY, Manson JE, et al. White Blood Cell Count and Total and Cause-Specific Mortality in the Women’s Health Initiative. Am J Epidemiol. 2017;186(1):63–72.


5 comments
Angie and Mickey – what a comprehensive set of notes! WOW! Dr R Abott is THE lab work doctor, plus he explains everything so simply; you think you understand and then you ask your GP for blood work and you can’t remember a thing, and sound illiterate! Thank you thank you thank you!!!
Sabine – right?! We think Dr. Abbott is amazing too! Thanks for the feedback!
Thank you for the opportunity to ask a question. I was diagnosed with Scleroderma 15 1/2 years ago. I worked out for 8 years and due to “life” different reasons I fell off my workout wagon fo close to a year. I started up again with a 5 mile walk the first day and weights and 4.4 mile walk the next. I had blood work on the next day and my C Reactive Protein levels were high also urine showed dehydration. Now my Dr is repeating the tests and adding some looking for Myositis. Could my inflammation markers be due to working out again after such a long sedentary period?
Thank you for your thoughts,
Sheryl Bishop
Very informative article…thanks for sharing such valuable information.
wow, this article was helpful in me understanding lab values and interpretation. I loved that Dr. Abbott reminded us to take the lab interpretation with the clinical presentation of the patient. This blog post helped me understand lab interpretation of TSH, T4 and T3. Thank you!